Indian Institute of Technology Madras
BS Degree Programme · Examination & Study Paper
BSMA1002 · Statistics for Data Science I
Variance, percentiles & outliers
Examination Instructions & Guidelines
- Solve on notebook/paper first before checking solutions.
- MCQ: Exactly 1 option is correct. Negative marking applies.
- MSQ: One or more options correct. Select all to score.
- NAT: Numerical response. No negative marking.
- Scientific calculator allowed for all calculations.
- Official answer key is sealed at the end of this sheet.
Quiz 1 · 26 Oct 2025 (AN)Quiz 1
- Q1NAT4 Marks·Write the number
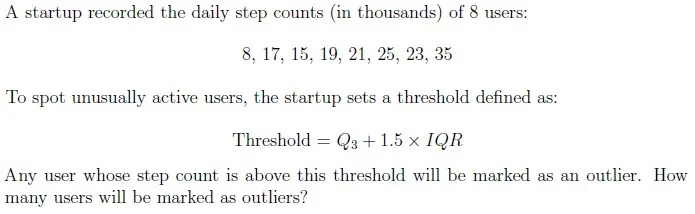 Your answer:
 - Q2NAT5 Marks·Write the number
There are 4 observations whose mean is 5 and population variance is 2.5. Two of the observations are known to be 4 and 6. Find the product of the remaining two observations.
Your answer: Read the passage below, then answer Q3–Q4
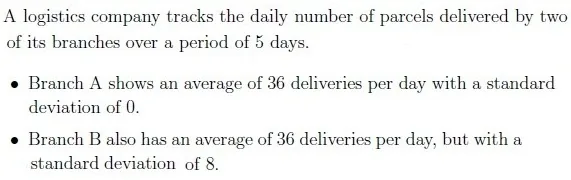
Based on the above data, answer the given subquestions.
Q3MSQ2 Marks·Choose all correct optionsChoose the correct statement (s).
- ASince both branches have the same average, their performance is equally consistent.
- BBranch A is more consistent than Branch B because its standard deviation is lower.
- CBranch A delivers exactly 36 parcels every day, while Branch B’s daily deliveries fluctuate around 36.
- DConsistency should be evaluated only on the basis of the mean.
- Q4NAT2 Marks·Write the number
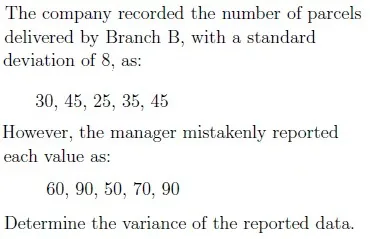 Your answer:
End Term · 31 Aug 2025 (FN)End Term
- Q5MCQ3 Marks·Choose one option
Consider the dataset 10, 27, 32, 15 and 22. A new dataset is obtained by subtracting 3 from every observation. Compute the value of (70th percentile of new dataset) - (30th percentile of the old dataset).
- A-3
- B9
- C3
- D-9
End Term · 31 Aug 2025 (AN)End Term
- Q6NAT3 Marks·Write the number
 Your answer:
 - Q7NAT3 Marks·Write the number
Consider the dataset 10, 27, 32, 15 and 22. If we subtract 3 from all observations, find the difference between IQR of the new dataset and the old dataset.
Your answer:
End Term · 13 Apr 2025 (FN)End Term
- Q8MCQ2 Marks·Choose one option

- A64
- B18
- C16
- D32
Read the passage below, then answer Q9–Q10
Consider a dataset such as 8, 12, 16, 24, and 20. Suppose we multiply all observations by 3. Based on the given information answer the subquestions.
Q9NAT2 Marks·Write the numberWhat will be the 25th percentile of the new dataset?
Your answer:- Q10NAT2 Marks·Write the number
Find IQR of the new dataset.
Your answer:
Qualifier · May 2024Qualifier
Read the passage below, then answer Q11
The marks (out of 100) scored by Manoj in a semester exam are given as 60, 70, 65, 75, 80. If Nitin has scored 5 marks more than Manoj in each subject.
Based on the given information, answer the subquestions.
Q11MCQ4 Marks·Choose one option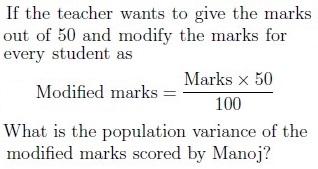
- A25
- B50
- C12.5
- DCannot determine
- Q12MSQ1 Mark·Choose all correct options
Choose the correct option(s):
- A25th percentile is known as the first quartile.
- BMedian is the 60th percentile of any data.
- CInter-quartile range is defined as the difference between third quartile and second quartile.
- DWe need to arrange the data in ascending order to calculate the percentile.
Qualifier · January 2024Qualifier
- Q13MSQ4 Marks·Choose all correct options
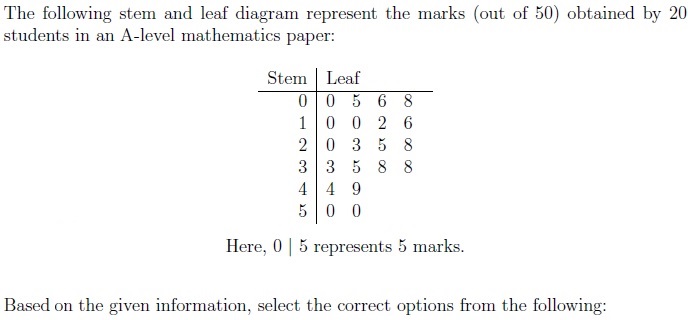
- AThere are 9 students who have scored greater than 20 marks.
- BThe data is bimodal.
- CMean is greater than the median.
- DInterquartile range is 28.
- Q14MCQ3 Marks·Choose one option

- A

- B

- C

- D

- A
Qualifier · September 2023Qualifier
- Q15NAT3 Marks·Write the number
 Your answer:
 Read the passage below, then answer Q16
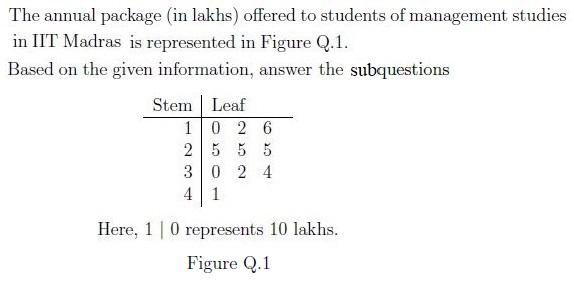 Q16MCQ4 Marks·Choose one option
What is the population variance of the given data if 5 is subtracted from each observations?
- A78.6
- B83.6
- C88.6
- D93.6
- Q17NAT2 Marks·Write the number
Find the IQR (Interquartile range) of the data 14, 20, 40, 23 and 18.
Your answer:
Qualifier · May 2023Qualifier
- Q18NAT4 Marks·Write the number
The mean and sample variance of the data set consisting of 10 observations is 22 and 81 respectively. Later it is noted that one observation 20 is wrongly noted as 15. what is the sample standard deviation of the original data set?(Enter the answer correct to two decimal accuracy)
Your answer: Read the passage below, then answer Q19–Q21
A clothe retailer wants to analyze the prices of different brands of t-shirts in his store. He randomly collected 10 t-shirts and prices (in rupees) of the t-shirts are 150, 550, 700, 240, 300, 750, 200, 180, 320, 420 respectively.
Based on the information, answer the given subquestions.
Q19MSQ3 Marks·Choose all correct optionsPrice below which 25% of the t-shirts fall.
- AIt is a measure of Q₁.
- B200 Rs.
- CIt is a measure of Q₃.
- D550 Rs.
- Q20MSQ3 Marks·Choose all correct options
Price of the t-shirt that separates price of the highest 25% of the data from the lower 75%.
- AIt is a measure of Q₂
- B550 Rupees
- CIt is a measure of Q₃
- D310 Rupees
- Q21MCQ3 Marks·Choose one option
How many outliers are in the given data set?
- A0
- B1
- C2
- DCan’t determined.
Qualifier · January 2023Qualifier
- Q22MCQ4 Marks·Choose one option
Suppose the number of cars sold by a car dealer in five months are 12, 8, 9, 20, 40. Which of the following is/are outliers?
- A-8
- B20
- C40
- D8
Read the passage below, then answer Q23
An analyst want to analyse the salary of employees in different organizations in a city. To analyse this, he has selected an organization and the data of salaries is tabulated as shown in Table Q.2.
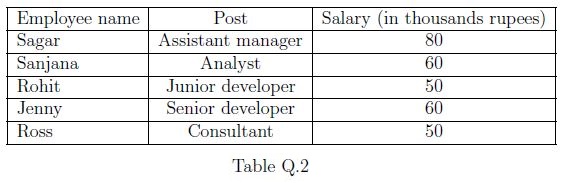
Based on the given information, answer the subquestions.
Q23NAT4 Marks·Write the numberWhat is the sample standard deviation of salary (in thousand rupees)? (Enter the answer correct to 2 decimal accuracy)
Your answer: