Indian Institute of Technology Madras
BS Degree Programme · Examination & Study Paper
BSMA1002 · Statistics for Data Science I
Association between two variables
Examination Instructions & Guidelines
- Solve on notebook/paper first before checking solutions.
- MCQ: Exactly 1 option is correct. Negative marking applies.
- MSQ: One or more options correct. Select all to score.
- NAT: Numerical response. No negative marking.
- Scientific calculator allowed for all calculations.
- Official answer key is sealed at the end of this sheet.
Quiz 1 · 26 Oct 2025 (AN)Quiz 1
- Q1MCQ3 Marks·Choose one option
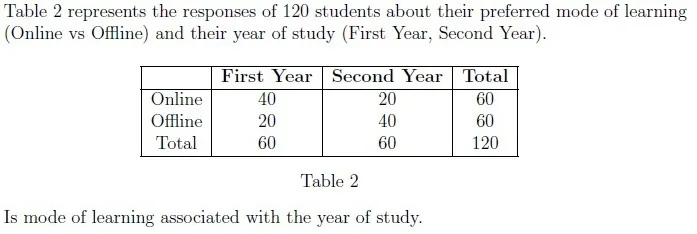
- AYes
- BNo
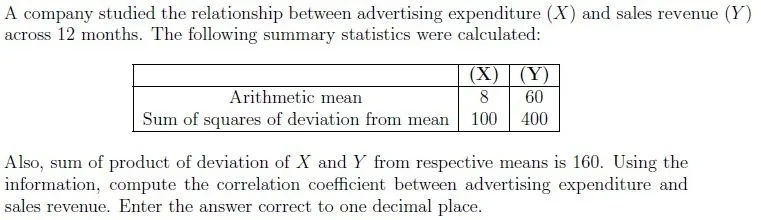
- Q2NAT2 Marks·Write the number
 Your answer:
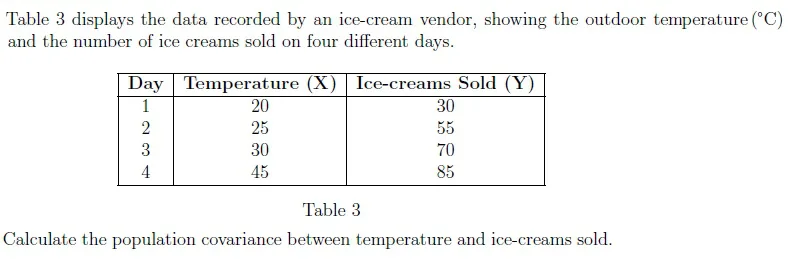
 - Q3NAT4 Marks·Write the number
 Your answer:
End Term · 13 Apr 2025 (AN)End Term
Read the passage below, then answer Q4–Q5
A shopping mall conducted a survey among 150 customers to study the relationship between age group and preferred payment method (Cash or Digital). The collected data is shown in the table Q.1:
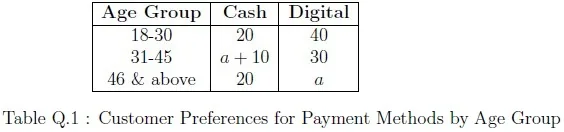
Based on the above data, answer the given subquestions.
Q4NAT2 Marks·Write the numberWhat proportion of the total customers prefer digital payments? Enter the answer correct to two decimal places.
Your answer:- Q5NAT1 Mark·Write the number
How many customers of age between 18 to 45 prefer cash payment?
Your answer:
Qualifier · May 2024Qualifier
Read the passage below, then answer Q6–Q7
Amit took a survey of a group of 32 college going students (consisting only of male and female students) to know whether they own a smartphone or not and he got to know the following information.
(i). There are 3 males who do not own a smartphone.
(ii). There are total 27 females.
(iii). There are total 26 students who do not own a smartphone.
Based on the above information, answer the given subquestions.
Q6MCQ2 Marks·Choose one optionCreate a two-way contingency table and find out the number of males in this group who own a smartphone?
- A0
- B2
- C3
- D4
- Q7MSQ3 Marks·Choose all correct options
Choose the correct option(s) after making a two-way contingency table.
- AThere are 40% of the males who do not own a smartphone.
- BThere are 14.81% of the females who own a smartphone.
- C18.75% of the total students own a smartphone.
- DWe can calculate covariance to find the association between “Gender” and “Ownership of the smartphone”.
- Q8MCQ2 Marks·Choose one option
Consider the following four images of the Scatter plot.
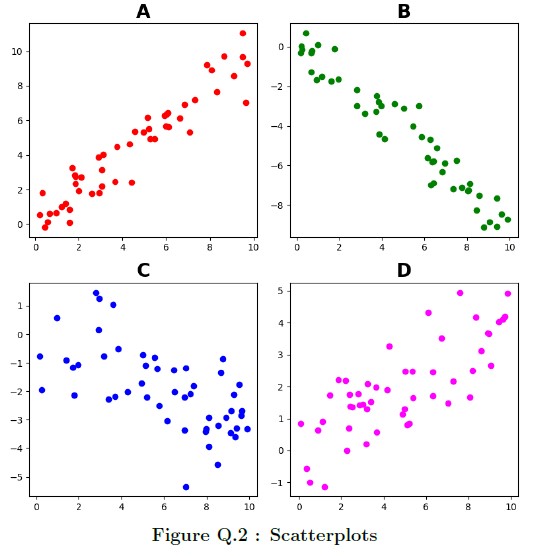 Please select the option that will represent the correlation values arranged in ascending order.
- AA < B < C < D
- BB < C < D < A
- CB < A < C < D
- DA < D < C < B
- Q9NAT3 Marks·Write the number
Find the population covariance between X and Y for the dataset given in Table Q.2.
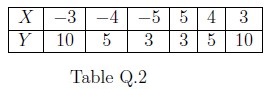 Your answer:
 Read the passage below, then answer Q10
The marks (out of 100) scored by Manoj in a semester exam are given as 60, 70, 65, 75, 80. If Nitin has scored 5 marks more than Manoj in each subject.
Based on the given information, answer the subquestions.
Q10NAT2 Marks·Write the numberCalculate the correlation coefficient between the marks scored by Manoj and Nitin.
Your answer:
Qualifier · January 2024Qualifier
- Q11MCQ2 Marks·Choose one option
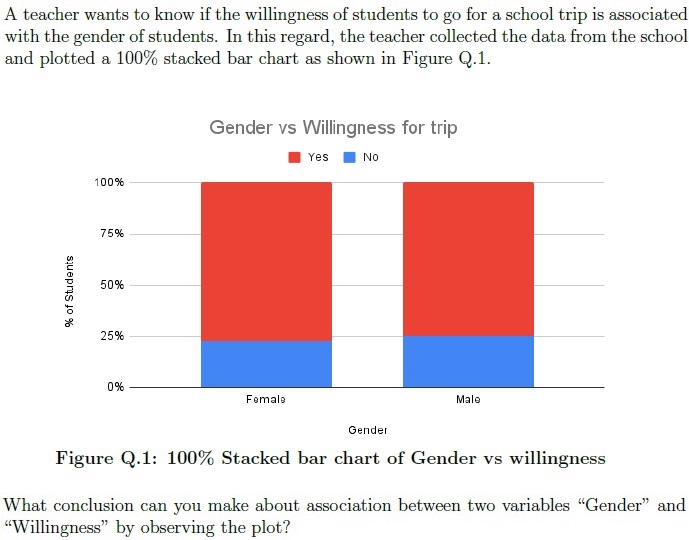
- AThere is an association between “Gender” and “Willingness” as row relative frequencies will be approximately same for all rows.
- BThere is no association between “Gender” and “Willingness” as row relative frequencies will be approximately same for all rows.
- CThere is an association between “Gender” and “Willingness” as row relative frequencies will be different for all rows.
- DThere is no association between “Gender” and “Willingness” as row relative frequencies will be different for all rows.
- Q12NAT4 Marks·Write the number
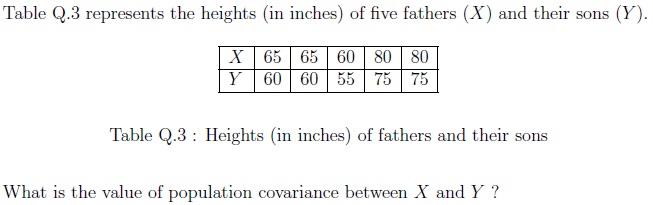 Your answer:
 - Q13MSQ5 Marks·Choose all correct options
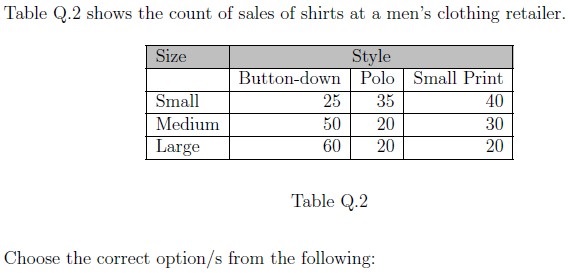
- AOf all the shirts with Polo style, there are 26.67% shirts of Medium size.
- BOf all the shirts with Small size, there are 25% shirts of Small Print style.
- CThere is no association between the size and style of shirts.
- DThere is an association between the size and style of shirts.
Qualifier · September 2023Qualifier
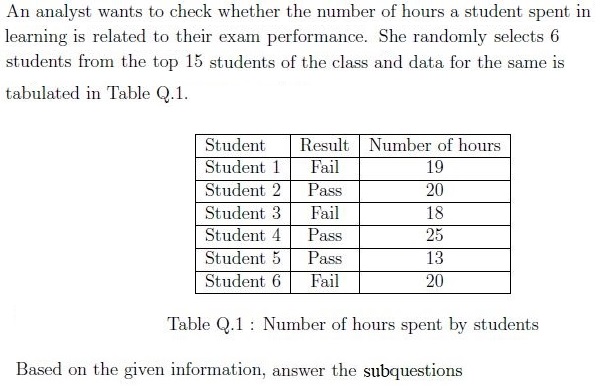
Read the passage below, then answer Q14–Q15
 Q14NAT5 Marks·Write the number
Calculate the absolute value of Point Bi-serial correlation coefficient between the result and number of hours spent. Enter the answer correct to three decimal places.
Your answer:- Q15MCQ2 Marks·Choose one option
Are the exam results of the selected students strongly influenced by the number of hours spent studying?
- AYes, because the absolute value of Point Bi-serial coefficient is close to 1.
- BNo, because the absolute value of Point Bi-serial coefficient is close to 1.
- CYes, because the absolute value of Point Bi-serial coefficient is close to 0.
- DNo, because the absolute value of Point Bi-serial coefficient is close to 0.
- Q16NAT4 Marks·Write the number
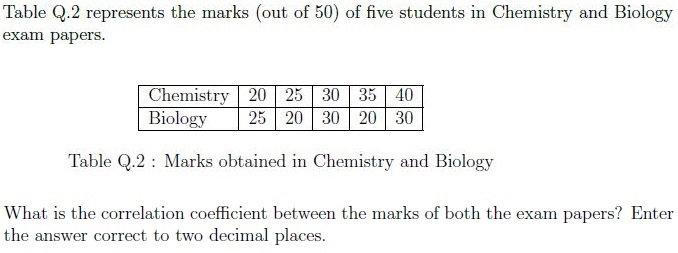 Your answer:
Qualifier · May 2023Qualifier
Read the passage below, then answer Q17–Q18
Table 5 represents the data set about Advertising Expenditure and the Sales Revenue of a company. An analyst wants to investigate the relationship between the Advertising Expenditure (in Lakhs of rupees) and the monthly Sales Revenue (in Lakhs of rupees) of a company over a period of 6 months.
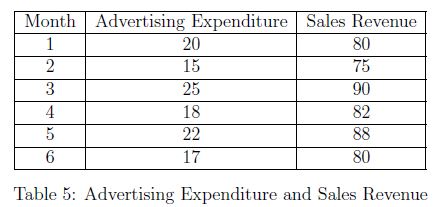
Based on the information, answer the given subquestions.
Q17MSQ2 Marks·Choose all correct optionsWhich measure(s) will help you to determine the existence of the relation between Sales Revenue and the Advertising Expenses?
- ACovariance
- BMean of both Sales and Advertising
- CCorrelation Coefficient
- DNone
- Q18NAT4 Marks·Write the number
What is the sample covariance between the Sales Revenue and Advertising Expenses?(Enter the answer correct to one decimal accuracy)
Your answer:
Qualifier · January 2023Qualifier
- Q19MSQ4 Marks·Choose all correct options
An analyst did a survey to know whether literacy rate affects voting rate among adults in villages. He collected the data from a village and the results are tabulated in Table Q.1.
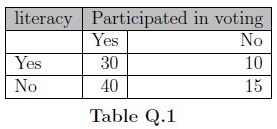 Choose the correct option/s?
- AOf all the literate adults, 25% do not participate in voting.
- BOf all the illiterate adults, 72.73% participate in voting.
- CIf all row relative frequencies are similar within each column then, it implies that all column relative frequencies will also be similar within each row.
- DIf all column relative frequencies are similar within each row then, it does not imply that all row relative frequencies will also be similar within each column.
- EThere is no association between literacy and voting participation.
- FThere is an association between literacy and voting participation.
- Q20MCQ3 Marks·Choose one option
Let X and Y represent the total marks of Mayur and Deepak in 5 subjects respectively. If the marks scored by Deepak is twice the marks scored by Mayur in each subject, then which of the following statement is correct?
- AThere is no correlation between X and Y .
- BThere is a weak positive correlation between X and Y .
- CThere is a strong positive correlation between X and Y .
- DInsufficient information.