Indian Institute of Technology Madras
BS Degree Programme · Examination & Study Paper
Business Data Management
Economy, demand & expenditure data
Examination Instructions & Guidelines
- Solve on notebook/paper first before checking solutions.
- MCQ: Exactly 1 option is correct. Negative marking applies.
- MSQ: One or more options correct. Select all to score.
- NAT: Numerical response. No negative marking.
- Scientific calculator allowed for all calculations.
- Official answer key is sealed at the end of this sheet.
End Term · 31 Aug 2025 (FN)End Term
- Q1MCQ1 Mark·Choose one option
In the context of economic circular flow, what do firms primarily provide to the factor market?
- AGoods and services
- BWages and rent
- CRaw materials
- DCapital investment
- Q2MCQ1 Mark·Choose one option
Which of the following is a non-government source of economic data in India?
- ANational Sample Survey (NSS)
- BEconomic Census
- CCentre for Monitoring Indian Economy (CMIE)
- DAnnual Survey of Industries (ASI)
- Q3MCQ1 Mark·Choose one option
What does a bimodal distribution in consumer spending data typically indicate?
- AUniform spending across all consumers
- BTwo distinct consumer groups with different spending patterns
- CRandom spending behavior
- DDeclining consumer confidence
End Term · 31 Aug 2025 (AN)End Term
- Q4MCQ1 Mark·Choose one option
What happens to the demand curve when consumer income increases for a normal good?
- AShifts to the left
- BShifts to the right
- CRemains unchanged
- DBecomes steeper
Quiz 2 · 3 Aug 2025 (AN)Quiz 2
- Q5MCQ1 Mark·Choose one option
What are the roles that the Government plays in the economic circular flow model?
- AProducer and Consumer
- BModerator and Participant
- CBoth Producer and Consumer & Moderator and Participant
- DNone of these
- Q6NAT1 Mark·Write the number
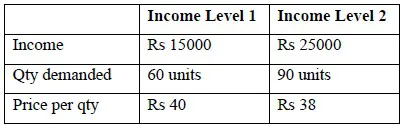
Determine the percentage change in total revenue when income increases from Rs 15000 to Rs 25000. (upto 3 decimals, hint : if your ans is 98% then enter 0.98 as your answer). Income level 1 1) Income = Rs 15,000 2) Qty demanded = 60 units 3) Price per qty = Rs 40 Income level 2 1) Income = Rs 25,000 2) Qty demanded = 90 units 3) Price per qty = Rs 38
Your answer:
End Term · 13 Apr 2025 (FN)End Term
- Q7MCQ1 Mark·Choose one option
What does the law of demand state?
- AAs the price of a good increases, the quantity demanded decreases
- BAs the price of a good decreases, the quantity demanded decreases
- CAs the price of a good increases, the quantity supplied decreases
- DAs the price of a good decreases, the quantity supplied increases
- Q8MSQ1 Mark·Choose all correct options
Which of the following conditions can use the concept of "weighted average" to analyse expenditure data?
- ABy considering importance of expenditure categories
- BBy considering the population size of different regions
- CBy adjusting for inflation over time
- DBy analyzing the impact of income levels on expenditure
Read the passage below, then answer Q9–Q10
Based on the sample data given answer the subquestions.
 Q9MCQ1 Mark·Choose one option
Determine the percentage change in total revenue when income increases from Rs 15000 to Rs 25000.
- A41.2%
- B42%
- C42.5%
- D41.8%
- Q10MCQ1 Mark·Choose one option
What is the type of goods based on the given table?
- ANormal Goods
- BInferior Goods
- CLuxury Goods
- DNone of these
End Term · 22 Dec 2024 (AN)End Term
- Q11MCQ1 Mark·Choose one option
In the context of economic flow, what do firms provide to households in exchange for labour?
- AServices
- BCapital
- CWages
- DGoods
- Q12MCQ1 Mark·Choose one option
Which of the following is NOT a government source of economic data mentioned in the segment?
- AEconomic Census
- BPeriodic Labour Force Survey (PLFS)
- CPurchasing Managers' Index (PMI)
- DNational Sample Survey
- Q13MCQ1 Mark·Choose one option
What implication does a bimodal distribution in household transportation expenditure data point to?
- AMost households spend a similar amount on transportation
- BThere are two distinct groups of households based on transportation spending
- CTransportation expenditure is evenly distributed across all households
- DThere is a negative correlation between income and transportation spending