Indian Institute of Technology Madras
BS Degree Programme · Examination & Study Paper
BSMA1002 · Statistics for Data Science I
Types of data & scales of measurement
Examination Instructions & Guidelines
- Solve on notebook/paper first before checking solutions.
- MCQ: Exactly 1 option is correct. Negative marking applies.
- MSQ: One or more options correct. Select all to score.
- Scientific calculator allowed for all calculations.
- Official answer key is sealed at the end of this sheet.
Quiz 1 · 26 Oct 2025 (AN)Quiz 1
- Q1MSQ2 Marks·Choose all correct options
If addition and subtraction are meaningful operation for a variable, then the scale(s) of measurement of the variable could be:
- ARatio
- BNominal
- COrdinal
- DInterval
- Q2MSQ2 Marks·Choose all correct options
Which of the following statements correctly describe Descriptive and Inferential Statistics?
- ADescriptive statistics uses probability theory to draw conclusions, while inferential statistics is represented through tables, charts, and graphs.
- BInferential statistics involves using sample data to make generalizations or predictions about a population.
- CBoth descriptive and inferential statistics only deal with numerical data, not categorical data.
- DDescriptive statistics involves summarizing data using measures such as mean, median,and standard deviation.
- Q3MSQ2 Marks·Choose all correct options
Choose the correct statement(s).
- ACross-sectional data are collected at a single point in time across several individuals, firms, or regions etc.
- BTime series data involve observations on a variable measured at a single point of time.
- CNominal scale provides both labelling and meaningful ranking of categories.
- DRatio scale has an absolute zero and allows for comparison of both differences and ratios between observations.
End Term · 31 Aug 2025 (AN)End Term
- Q4MSQ2 Marks·Choose all correct options
Which of the following statement(s) is/are incorrect?
- AThe annual income of 1000 individuals surveyed for year 2024 is an example of time-series data.
- BThe brand of a smartphone used by students is a categorical variable.
- CEducational qualifications such as elementary, secondary, and higher secondary has an ordinal scale of measurement.
- DMaking predictions about population behavior based on sample data is a part of Descriptive Statistics.
End Term · 13 Apr 2025 (FN)End Term
- Q5MSQ2 Marks·Choose all correct options
Which of the following option(s) is/are correct for a variable with an ordinal scale of measurement?
- AThe data can be arranged in a meaningful order.
- BArithmetic operations like addition and subtraction are valid.
- CThe intervals between values are equal and meaningful.
- DThe mode and median can be determined, but not the mean.
End Term · 13 Apr 2025 (AN)End Term
- Q6MSQ2 Marks·Choose all correct options
A surveyor collects data on the electricity bills of 100 randomly selected households in a particular month. Which of the following statements about this data is/are correct?
- AThe electricity bill in rupees is a continuous variable.
- BThe data collected represents cross-sectional data.
- CThe electricity bill in rupees is a categorical variable.
- DThe data collected represents time-series data.
End Term · 22 Dec 2024 (FN)End Term
- Q7MSQ2 Marks·Choose all correct options
Which of the following options is/are incorrect for a variable having ratio scale of measurement?
- ADifference between the values of a variable can not be evaluated.
- BOrder of the data is meaningful.
- CMultiplication and division of values of a variable is possible.
- DIt does not have an absolute zero.
End Term · 22 Dec 2024 (AN)End Term
- Q8MSQ2 Marks·Choose all correct options
Which of the following options is/are incorrect for a variable having ratio scale of measurement?
- ADifference between the values of a variable can not be evaluated.
- BOrder of the data is meaningful.
- CMultiplication and division of values of a variable is possible.
- DIt does not have an absolute zero.
Qualifier · May 2024Qualifier
- Q9MSQ2 Marks·Choose all correct options
Which of the following statement(s) is/are true?
- AStructured data does not follow a predefined format, whereas unstructured data does.
- BRecording of the data over time comes under Cross Sectional data.
- CTime (in minutes) taken by a student to reach school from his home is a continuous variable.
- DComments on a youtube video comes under the unstructured data.
- Q10MCQ3 Marks·Choose one option
Consider the following three statements: Statement 1 : Election symbol is a categorical variable. Statement 2 : Election symbol has a nominal scale of measurement. Statement 3 : Number of votes received by a candidate is a continuous variable. Choose the correct option from the following:
- AStatement-2 and statement-3 both are correct.
- BStatement-1 and statement-3 both are correct.
- CStatement-1 and statement-2 both are correct.
- DAll statements are correct.
- Q11MCQ2 Marks·Choose one option
Choose the correct statement from the following:
- ADescriptive statistics is concerned with drawing of conclusions from the sample data.
- BInferential statistics is concerned with describing and summarizing the data.
- CInferential statistics doesn’t require sample data.
- DAll statements are incorrect.
Qualifier · January 2024Qualifier
- Q12MSQ2 Marks·Choose all correct options
To ensure the accuracy of conclusions drawn through inferential statistics, which of the following statement(s) must be true?
- ASample should not be randomly selected.
- BSample should be randomly selected.
- CSample should be a good representative of the population.
- DSample should not be representative of the population.
- Q13MSQ2 Marks·Choose all correct options
Which of the following statement(s) is/are true?
- AThe gross annual income for each of 1000 randomly chosen households in New York City for the year 2000 is a time series data.
- BPassenger Name Record (PNR) number has an ordinal scale of measurement.
- CRevenue generated by India through tea exports to 10 different countries in year 2010 is a cross-sectional data.
- DShirt size is a categorical variable.
- Q14MSQ3 Marks·Choose all correct options
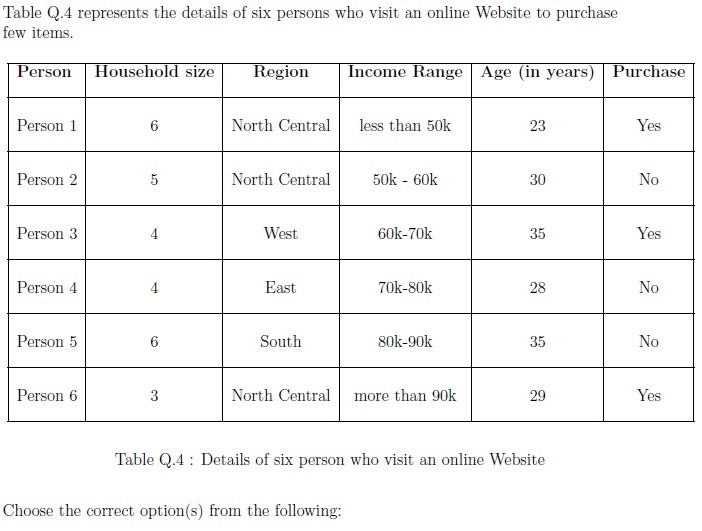
- APurchase and Region are categorical variables.
- BIncome Range has nominal scale of measurement.
- CAge has a ratio scale of measurement.
- DHousehold size is a discrete numerical variable.
- EPurchase has an ordinal scale of measurement.
Qualifier · September 2023Qualifier
Read the passage below, then answer Q15–Q16
The Head of the transportation facility at the IIT Madras campus wants to conduct a survey to rate the bus services offered to all the students. He randomly selects 100 final year students from the campus. Based on the given information, answer the subquestions
Q15MSQ3 Marks·Choose all correct optionsIdentify the sample and the population.
- AThe population is all the students at IIT Madras campus.
- BThe sample is all the final year students at IIT Madras campus.
- CThe sample is 100 randomly selected final year students at IIT Madras campus.
- DThe population is all the final year students at IIT Madras campus.
- Q16MCQ2 Marks·Choose one option
Identify the correct statement from the following.
- ASelected sample is a good representation of the population.
- BSelected sample is not a good representation of the population.
- Q17MSQ2 Marks·Choose all correct options
Which of the following statement(s) is(are) true?
- AEye colour of a person has ordinal scale of measurement.
- BRecording the price of bitcoin every hour for 3 days is a time-series data.
- CNumber of students present in a class is a discrete variable.
- DAmount of milk (in litres) is a categorical variable.
Qualifier · May 2023Qualifier
- Q18MCQ2 Marks·Choose one option
A researcher wants to investigate the relationship between studying hours and exam scores. He collects the data on studying hours and exam scores from a sample of 100 students and perform a correlation analysis. Which branch of statistics does this analysis belong to?
- ADescriptive Statistics.
- BInferential Statistics.
- CBoth Descriptive and Inferential Statistics.
- DNeither Descriptive nor Inferential Statistics.
- Q19MSQ2 Marks·Choose all correct options
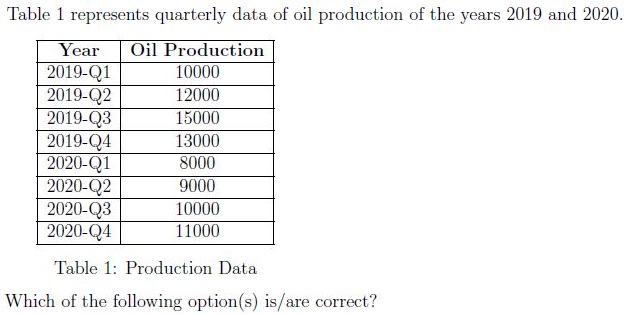
- AIt is a time series Data.
- BIt is a cross sectional Data.
- CIt is a structured Data.
- DIt is an unstructured Data.
Read the passage below, then answer Q20–Q21
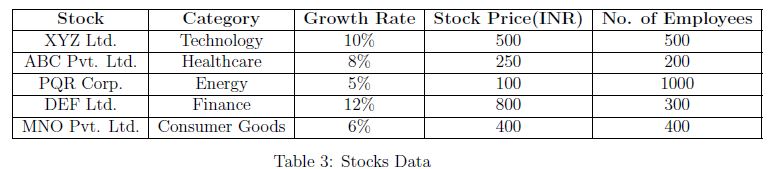
Based on the given data in the Table 3 , answer the subquestions.
 Q20MSQ2 Marks·Choose all correct options
Which of the following statements is/are true?
- AXYZ Ltd. is a variable.
- BNumber of employees have a ratio scale of measurement.
- CGrowth Rate (%) is a variable.
- DCategory have an interval scale of measurement.
- Q21MCQ2 Marks·Choose one option
What is the scale of measurement of “Category”?
- AOrdinal Scale.
- BRatio Scale.
- CNominal Scale.
- DInterval Scale.
Qualifier · January 2023Qualifier
- Q22MSQ3 Marks·Choose all correct options
Which of the following statements is/are true?
- AA sample is the subset of a population.
- BNumerical variables can have all the properties of ordinal and nominal scales of measurement.
- CCategorical variable can have numerical properties.
- DCorrelation coefficient measures a linear association between two numerical variables.
- Q23MSQ3 Marks·Choose all correct options
Which of the following represent(s) cross sectional data?
- ACensus of tigers estimated in four different countries in 2021.
- BYearly irrigation report released by a government over the period of ten years.
- CRevenue generated by a company in four different states in 2022.
- DMonthly expenditure of a family in 2020.
- Q24MSQ3 Marks·Choose all correct options
Choose the correct statement/s ?
- AA nominal scale has the property of labelling the categories and it does not involve the ranking of data.
- BAn ordinal scale has all the properties of nominal scale and it involves the ranking of data.
- CAn Interval scale has all the properties of ordinal scale and it satisfies the absolute zero property.
- DA ratio scale has all the properties of interval scale and it does not satisfy the absolute zero property.
Read the passage below, then answer Q25
An analyst want to analyse the salary of employees in different organizations in a city. To analyse this, he has selected an organization and the data of salaries is tabulated as shown in Table Q.2.
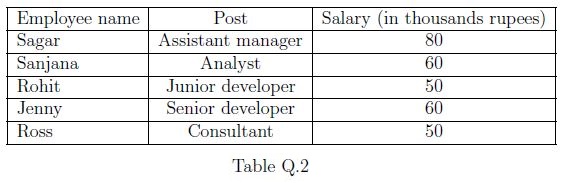
Based on the given information, answer the subquestions.
Q25MCQ2 Marks·Choose one optionBased on the data collected from an organisation, analyst made a statement that the average salary of an employee is 50,000 rupees in different organizations in the city. The given statement of analyst is based on which kind of statistical analysis ?
- ADescriptive statistics
- BInferential statistics
Official KeyMaster Answer Key & Explanations
Official answer keys from IIT Madras BS past papers. Click any question to review.
Reveal KeyCollapse Key
Master Answer Key & Explanations
Official answer keys from IIT Madras BS past papers. Click any question to review.