Indian Institute of Technology Madras
BS Degree Programme · Examination & Study Paper
BSMA1002 · Statistics for Data Science I
Qualifier · May 2024
Examination Instructions & Guidelines
- Solve on notebook/paper first before checking solutions.
- MCQ: Exactly 1 option is correct. Negative marking applies.
- MSQ: One or more options correct. Select all to score.
- NAT: Numerical response. No negative marking.
- Scientific calculator allowed for all calculations.
- Official answer key is sealed at the end of this sheet.
- Q1MSQ2 Marks·Choose all correct options
Figure Q.1 shows the sales distribution of the number of bottles of different types of soft drinks in a shop on a particular day.
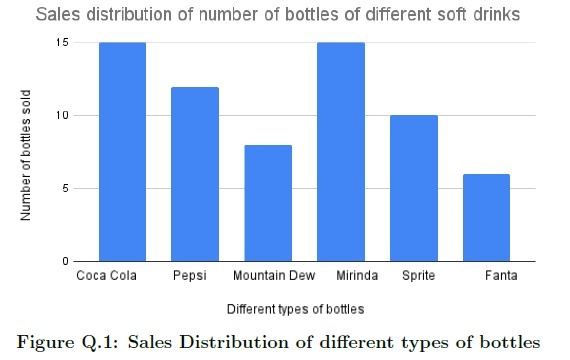 Which of the following option(s) is/are true?
- AMedian of the data will be either “Mountain Dew” or “Mirinda”.
- BThe data is bimodal.
- CMode is not defined for the given data.
- DMedian is not defined for the given data.
- Q2MSQ2 Marks·Choose all correct options
Which of the following statement(s) is/are true?
- AStructured data does not follow a predefined format, whereas unstructured data does.
- BRecording of the data over time comes under Cross Sectional data.
- CTime (in minutes) taken by a student to reach school from his home is a continuous variable.
- DComments on a youtube video comes under the unstructured data.
Read the passage below, then answer Q3–Q4
Table Q.1 represents the number of books read by five students in a year.
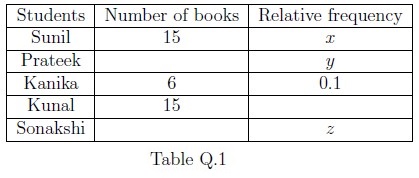
Based on the above data, answer the given subquestions
Q3NAT2 Marks·Write the numberWhat is the value of x? Enter the answer correct to two decimal places.
Your answer:- Q4MCQ3 Marks·Choose one option
If the number of books read by Prateek is same as the number of books read by Sonakshi, then find the value of y + z.
- A0.2
- B0.24
- C0.4
- DInsufficient information.
Read the passage below, then answer Q5–Q6
Amit took a survey of a group of 32 college going students (consisting only of male and female students) to know whether they own a smartphone or not and he got to know the following information.
(i). There are 3 males who do not own a smartphone.
(ii). There are total 27 females.
(iii). There are total 26 students who do not own a smartphone.
Based on the above information, answer the given subquestions.
Q5MCQ2 Marks·Choose one optionCreate a two-way contingency table and find out the number of males in this group who own a smartphone?
- A0
- B2
- C3
- D4
- Q6MSQ3 Marks·Choose all correct options
Choose the correct option(s) after making a two-way contingency table.
- AThere are 40% of the males who do not own a smartphone.
- BThere are 14.81% of the females who own a smartphone.
- C18.75% of the total students own a smartphone.
- DWe can calculate covariance to find the association between “Gender” and “Ownership of the smartphone”.
- Q7MCQ3 Marks·Choose one option
Consider the following three statements: Statement 1 : Election symbol is a categorical variable. Statement 2 : Election symbol has a nominal scale of measurement. Statement 3 : Number of votes received by a candidate is a continuous variable. Choose the correct option from the following:
- AStatement-2 and statement-3 both are correct.
- BStatement-1 and statement-3 both are correct.
- CStatement-1 and statement-2 both are correct.
- DAll statements are correct.
- Q8MCQ2 Marks·Choose one option
Choose the correct statement from the following:
- ADescriptive statistics is concerned with drawing of conclusions from the sample data.
- BInferential statistics is concerned with describing and summarizing the data.
- CInferential statistics doesn’t require sample data.
- DAll statements are incorrect.
- Q9MCQ2 Marks·Choose one option
Consider the following four images of the Scatter plot.
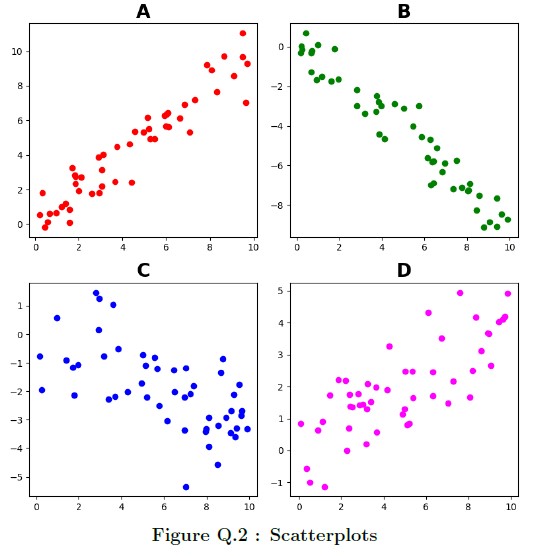 Please select the option that will represent the correlation values arranged in ascending order.
- AA < B < C < D
- BB < C < D < A
- CB < A < C < D
- DA < D < C < B
- Q10NAT3 Marks·Write the number
 Your answer:
 - Q11NAT3 Marks·Write the number
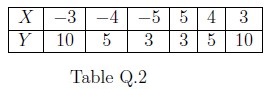
Find the population covariance between X and Y for the dataset given in Table Q.2.
 Your answer:
 Read the passage below, then answer Q12–Q14
The marks (out of 100) scored by Manoj in a semester exam are given as 60, 70, 65, 75, 80. If Nitin has scored 5 marks more than Manoj in each subject.
Based on the given information, answer the subquestions.
Q12NAT2 Marks·Write the numberFind the mean of the marks scored by Nitin.
Your answer:- Q13MCQ4 Marks·Choose one option
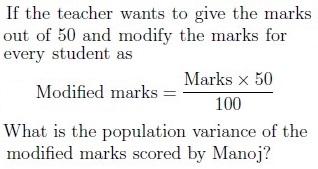
- A25
- B50
- C12.5
- DCannot determine
- Q14NAT2 Marks·Write the number
Calculate the correlation coefficient between the marks scored by Manoj and Nitin.
Your answer: Read the passage below, then answer Q15–Q16
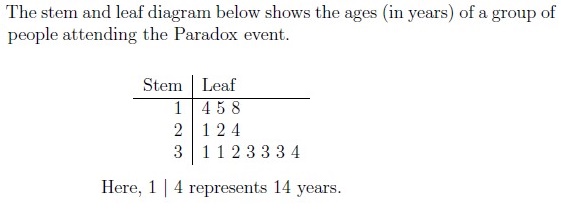
Based on the above data, answer the given subquestions
Q15NAT2 Marks·Write the numberWhat will be the median age for this group?
Your answer:- Q16NAT1 Mark·Write the number
How many people are above 23 years of Age in the given stem and leaf plot?
Your answer: - Q17NAT1 Mark·Write the number
 Your answer:
 - Q18MSQ1 Mark·Choose all correct options
Choose the correct option(s):
- A25th percentile is known as the first quartile.
- BMedian is the 60th percentile of any data.
- CInter-quartile range is defined as the difference between third quartile and second quartile.
- DWe need to arrange the data in ascending order to calculate the percentile.