Indian Institute of Technology Madras
BS Degree Programme · Examination & Study Paper
BSMA1002 · Statistics for Data Science I
Qualifier · May 2023
Examination Instructions & Guidelines
- Solve on notebook/paper first before checking solutions.
- MCQ: Exactly 1 option is correct. Negative marking applies.
- MSQ: One or more options correct. Select all to score.
- NAT: Numerical response. No negative marking.
- Scientific calculator allowed for all calculations.
- Official answer key is sealed at the end of this sheet.
- Q1MCQ2 Marks·Choose one option
A researcher wants to investigate the relationship between studying hours and exam scores. He collects the data on studying hours and exam scores from a sample of 100 students and perform a correlation analysis. Which branch of statistics does this analysis belong to?
- ADescriptive Statistics.
- BInferential Statistics.
- CBoth Descriptive and Inferential Statistics.
- DNeither Descriptive nor Inferential Statistics.
- Q2MSQ2 Marks·Choose all correct options
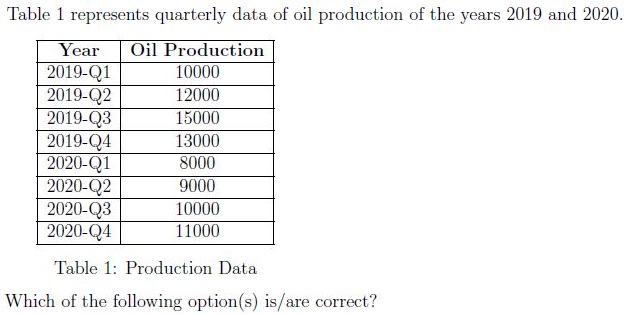
- AIt is a time series Data.
- BIt is a cross sectional Data.
- CIt is a structured Data.
- DIt is an unstructured Data.
- Q3MSQ2 Marks·Choose all correct options
Which of the following is/are correct?
- AMean and Mode can only be defined for a numerical data.
- BMode can be defined for a categorical data.
- CThere can be more than one mode for a data.
- DMedian can be measured for a categorical variable only if the variable is nominal.
- EThe sum of relative frequencies of all the observations in a given data set is always equal to 1.
- Q4NAT4 Marks·Write the number
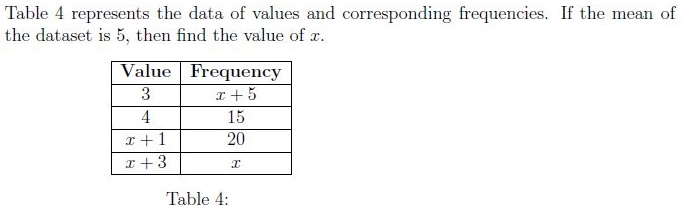 Your answer:
 - Q5NAT4 Marks·Write the number
The mean and sample variance of the data set consisting of 10 observations is 22 and 81 respectively. Later it is noted that one observation 20 is wrongly noted as 15. what is the sample standard deviation of the original data set?(Enter the answer correct to two decimal accuracy)
Your answer: Read the passage below, then answer Q6–Q8
Table 2 represents the movies released in 2022 on the OTT platform.
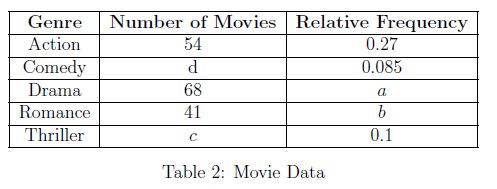
Based on the information, answer the given subquestions.
Q6NAT2 Marks·Write the numberFind the total number of released movies in 2022 on OTT Platform.
Your answer:- Q7NAT2 Marks·Write the number
Find the number of Thriller and Comedy movies released in 2022 on OTT Platform.
Your answer: - Q8NAT3 Marks·Write the number
Calculate a + b. (Enter the answer correct to three decimal accuracy)
Your answer: Read the passage below, then answer Q9–Q10
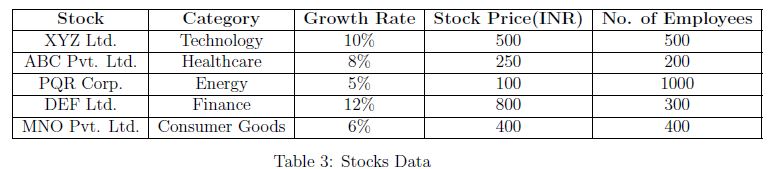
Based on the given data in the Table 3 , answer the subquestions.
 Q9MSQ2 Marks·Choose all correct options
Which of the following statements is/are true?
- AXYZ Ltd. is a variable.
- BNumber of employees have a ratio scale of measurement.
- CGrowth Rate (%) is a variable.
- DCategory have an interval scale of measurement.
- Q10MCQ2 Marks·Choose one option
What is the scale of measurement of “Category”?
- AOrdinal Scale.
- BRatio Scale.
- CNominal Scale.
- DInterval Scale.
Read the passage below, then answer Q11–Q12
Table 5 represents the data set about Advertising Expenditure and the Sales Revenue of a company. An analyst wants to investigate the relationship between the Advertising Expenditure (in Lakhs of rupees) and the monthly Sales Revenue (in Lakhs of rupees) of a company over a period of 6 months.
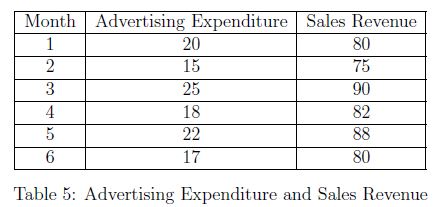
Based on the information, answer the given subquestions.
Q11MSQ2 Marks·Choose all correct optionsWhich measure(s) will help you to determine the existence of the relation between Sales Revenue and the Advertising Expenses?
- ACovariance
- BMean of both Sales and Advertising
- CCorrelation Coefficient
- DNone
- Q12NAT4 Marks·Write the number
What is the sample covariance between the Sales Revenue and Advertising Expenses?(Enter the answer correct to one decimal accuracy)
Your answer: Read the passage below, then answer Q13–Q15
A clothe retailer wants to analyze the prices of different brands of t-shirts in his store. He randomly collected 10 t-shirts and prices (in rupees) of the t-shirts are 150, 550, 700, 240, 300, 750, 200, 180, 320, 420 respectively.
Based on the information, answer the given subquestions.
Q13MSQ3 Marks·Choose all correct optionsPrice below which 25% of the t-shirts fall.
- AIt is a measure of Q₁.
- B200 Rs.
- CIt is a measure of Q₃.
- D550 Rs.
- Q14MSQ3 Marks·Choose all correct options
Price of the t-shirt that separates price of the highest 25% of the data from the lower 75%.
- AIt is a measure of Q₂
- B550 Rupees
- CIt is a measure of Q₃
- D310 Rupees
- Q15MCQ3 Marks·Choose one option
How many outliers are in the given data set?
- A0
- B1
- C2
- DCan’t determined.