Indian Institute of Technology Madras
BS Degree Programme · Examination & Study Paper
BSMA1002 · Statistics for Data Science I
End Term · 31 Aug 2025 (Afternoon)
Examination Instructions & Guidelines
- Solve on notebook/paper first before checking solutions.
- MCQ: Exactly 1 option is correct. Negative marking applies.
- MSQ: One or more options correct. Select all to score.
- NAT: Numerical response. No negative marking.
- Scientific calculator allowed for all calculations.
- Official answer key is sealed at the end of this sheet.
- Q1MCQ2 Marks·Choose one option
Find the number of rearrangements of the letters in the word COMMITTEE.
- A

- B

- C

- D

- A
- Q2MCQ2 Marks·Choose one option
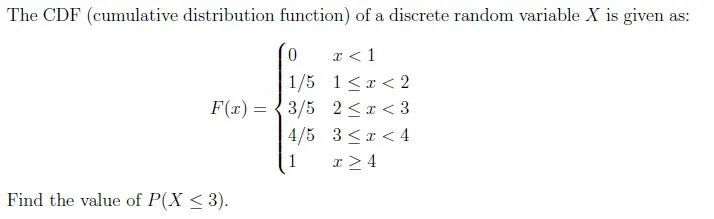
- A0.6
- B0.8
- C0.2
- D1
- Q3MSQ2 Marks·Choose all correct options

- A
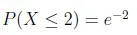
- B
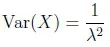
- C

- D

- A
- Q4MSQ2 Marks·Choose all correct options
Which of the following statement(s) is/are incorrect?
- AThe annual income of 1000 individuals surveyed for year 2024 is an example of time-series data.
- BThe brand of a smartphone used by students is a categorical variable.
- CEducational qualifications such as elementary, secondary, and higher secondary has an ordinal scale of measurement.
- DMaking predictions about population behavior based on sample data is a part of Descriptive Statistics.
- Q5NAT3 Marks·Write the number
 Your answer:
 - Q6NAT3 Marks·Write the number
 Your answer:
 - Q7NAT3 Marks·Write the number
The number of vehicles passing through a highway toll booth in a minute follows a Poisson distribution with mean λ = 4. Find the probability that at most two vehicle pass through highway toll booth in a minute. Enter the answer correct to two decimal places. (Use : e^4 = 54.60, e^(1/4) = 1.28, e^(-4) = 0.02, e^(-1/4) = 0.78)
Your answer: - Q8NAT3 Marks·Write the number
 Your answer:
 - Q9NAT3 Marks·Write the number
Consider the dataset 10, 27, 32, 15 and 22. If we subtract 3 from all observations, find the difference between IQR of the new dataset and the old dataset.
Your answer: Read the passage below, then answer Q10–Q11
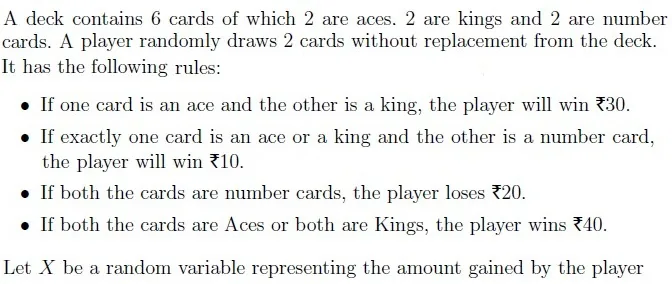
Based on the above data, answer the given subquestions.
Q10MCQ1 Mark·Choose one optionFind the range of X.
- A{20, 10, 30, 40}
- B{−20, 10, 30, 40}
- C{−20, 0, 10, 30, 40}
- D{0, 10, 20, 30, 40}
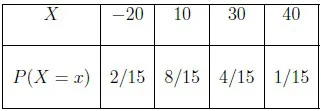
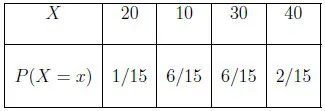
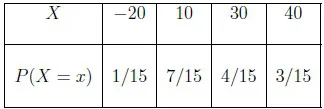
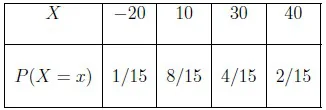
- Q11MCQ4 Marks·Choose one option
Find the PMF of X.
- A
- B
- C
- D
- A
Read the passage below, then answer Q12–Q13

Based on the above data, answer the given subquestions.
Q12NAT3 Marks·Write the numberFind the value of a.
Your answer:- Q13NAT2 Marks·Write the number
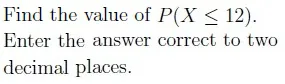 Your answer:
 Read the passage below, then answer Q14–Q15
A box contains 4 red balls and 5 blue balls. Three balls are drawn at random without replacement. Based on the above data, answer the given subquestions.
Q14NAT3 Marks·Write the numberWhat is the probability that all three balls drawn are of the same colour? Enter the answer correct to two decimal places.
Your answer:- Q15NAT4 Marks·Write the number
Let X denote the number of red balls selected. Find the value of P(X = 3 | X ≥ 1) Enter the answer correct to two decimal places.
Your answer: