Indian Institute of Technology Madras
BS Degree Programme · Examination & Study Paper
Business Analytics
Linear regression (SLR & MLR)
Examination Instructions & Guidelines
- Solve on notebook/paper first before checking solutions.
- MCQ: Exactly 1 option is correct. Negative marking applies.
- MSQ: One or more options correct. Select all to score.
- NAT: Numerical response. No negative marking.
- Scientific calculator allowed for all calculations.
- Official answer key is sealed at the end of this sheet.
End Term · 31 Aug 2025 (FN)End Term
Read the passage below, then answer Q1–Q3
The Following Comprehension and Related Questions are Purely Hypothetical
A company has collected data on the average monthly electricity consumed for air conditioning (dependent variable) relative to (i) Average ambient temperature of the month, (ii) Total number of working days in the month and (iii) Average number of employees who have worked in that month. This data is provided in Table-1. Additionally, the correlation matrix for the different variables in Table-1 is provided in Figure-1. Given this information, answer the given subquestions.
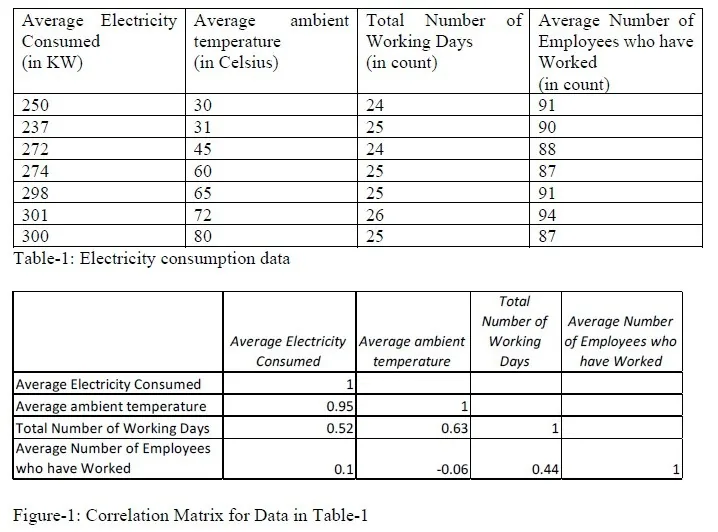 Q1NAT2 Marks·Write the number
What is the total variability in the dependent variable? [Note: Enter your answer in decimal rounded to two decimal places. For example, if your answer is 1.235 then enter the answer as “1.24”]
Your answer:- Q2NAT2 Marks·Write the number
What is the expected percentage inflation (increase) in the standard error of the beta value corresponding to “Average Number of Employees who have Worked” due to “Total Number of Working Days” if a model with only these two variables is built for predicting “Average Electricity Consumed”? [Note: Enter your answer in “PERCENTAGE” rounded to two decimal places without the percentage symbol. For example, if your answer is 1.235% then enter the answer as “1.24”]
Your answer: - Q3MSQ1 Mark·Choose all correct options
Based on the expected percentage inflation (increase) in the standard error of the beta value corresponding to “Average Number of Employees who have Worked” due to “Total Number of Working Days” if a model with only these two variables is built for predicting “Average Electricity Consumed”, which of the following statements is/are TRUE (choose all that is applicable)?
- AThe t-statistic corresponding to the “Beta value of Average Number of Employees who have Worked” will increase. Hence, the corresponding NULL HYPOTHESIS will be REJECT
- BThe t-statistic corresponding to the “Beta value of Average Number of Employees who have Worked” will increase. Hence, the corresponding NULL HYPOTHESIS will NOT BE REJECTED
- CThe t-statistic corresponding to the “Beta value of Total Number of Working Days” will increase. Hence, the corresponding NULL HYPOTHESIS will be REJECT
- DThe t-statistic corresponding to the “Beta value of Total Number of Working Days” will increase. Hence, the corresponding NULL HYPOTHESIS will NOT be REJECT
- Q4MCQ1 Mark·Choose one option
Say you build a multiple regression model using 6 independent variables and 20 data points. This is called Model-1. The R-Square for Model-1 is 94%. You then decide to add four more variables (such that the sample size is still 20) to the model and develop a new model called Model-2. The R- Squared for Model-2 is 95%. Then which of the following statements is/are TRUE?
- AModel-1 is better as it has lower R-Squared
- BModel-1 is better as it has lower Adjusted R-Square
- CModel-1 is better as it has higher Adjusted R-Square
- DModel-2 is better as it has higher R-Square
- EModel-2 is better as it has lower Adjusted R-Square
- FModel-2 is better as it has higher Adjusted R-Square
- GNone of these
End Term · 31 Aug 2025 (AN)End Term
- Q5MSQ1 Mark·Choose all correct options
Which of the following Regression equations is/are MLR? (Choose all that is/are applicable)
- A

- B

- C

- D

- E

- F

- A
Read the passage below, then answer Q6–Q8
The Following Comprehension and Related Subquestions are Purely Hypothetical Table-2 provides the Cumulative Television Rating Points (CTRP), money spend on promotion (in Lakhs, denoted by “P”), and the advertisement revenue (in Lakhs, denoted by “R”) generated over a one-month period for 8 different television programs. The Revenue a TV show makes is the Dependent Variable. Using this data, answer the given subquestions.
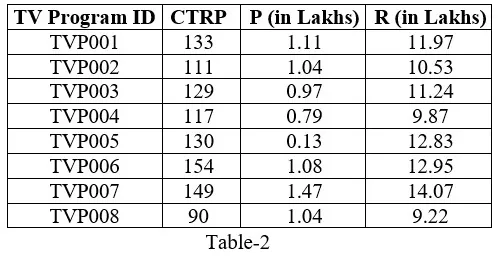 Q6NAT2 Marks·Write the number
What is the total variability in the dependent variable? [Note: Enter your answer in decimal rounded to two decimal places. For example, if your answer is 1.235 then enter the answer as “1.24”]
Your answer:- Q7NAT1 Mark·Write the number
The correlation coefficient between “CTRP” and “P” is 0.19. Then, what will be the Adjusted R- Square for the model (built using data in Table-2), where “CTRP” is the response variable and “P” is the predictor? [Note: Enter your answer in decimal rounded to two decimal places. For example, if your answer is 1.235 then enter the answer as “1.24”]
Your answer: - Q8NAT2 Marks·Write the number
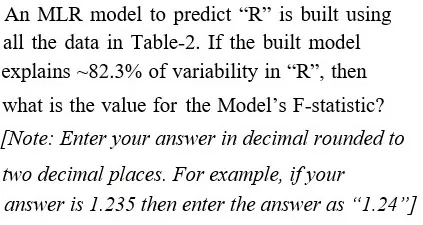 Your answer:
Quiz 2 · 3 Aug 2025 (AN)Quiz 2
Read the passage below, then answer Q9–Q10
Data on “Urban Population (UP)” of a country and the “GDP” of the same country are collected. The “GDP” is captured as a percentage (that is “10.5%” is captured as “10.5”) and the “UP” is captured in crores of people (that is “1,20,00,000” is captured as “1.2”). From the raw data, the analyst has identified that the relation is non-linear. Hence, the analyst applies a natural logarithmic transformation on both variables (the independent variable is “GDP” and the dependent variable is “UP”). The transformed data is modelled as a Simple Linear Regression and the developed model is presented in Figure-1. Using this information, answer the given subquestions.
 Q9NAT1 Mark·Write the number
How many degrees of freedom will be present for the “Regression” term in the ANOVA table (nomenclature as per excel)?
Your answer:- Q10NAT2 Marks·Write the number
If the GDP in 2024 was 15%, then what is the predicted “UP” (in crores of people) based on the SLR model? (Note: Enter your answer rounded to two decimal places. For example, if your answer is “1.235” then enter it as “1.24”)
Your answer: Read the passage below, then answer Q11–Q17
Milo’s Bakery is famous for three products “BA Biscuits (BAB)”, “TA Controversy Cake (TACC)” and “Hot Argument Drink (HAD)”. Dr.Milo, the owner of the shop, is an aspiring data analyst. He has collected 5 days of data. On each day, he captures the number of each product made and total kilogram of cooking gas consumed. Using all the collected data, Dr.Milo has built a linear regression model in excel, and the partial regression output is provided in Figure-2. Using this information, answer the given subquestions.
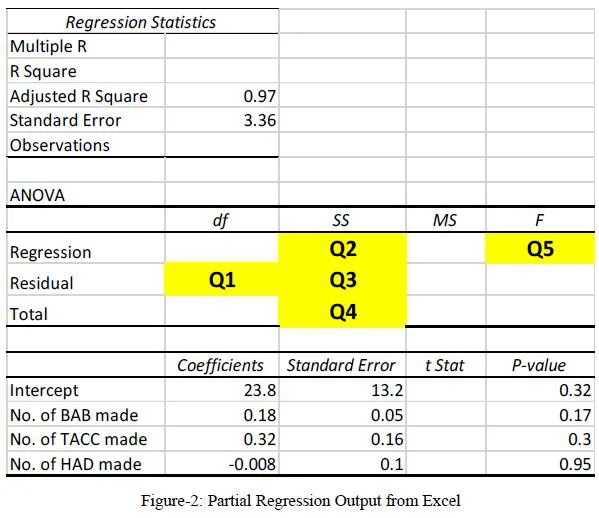 Q11NAT0.5 Marks·Write the number
What is the sample size for building the model in Figure-2?
Your answer:- Q12NAT1 Mark·Write the number
What is the value of Q1?
Your answer: - Q13NAT1 Mark·Write the number
What is the value of Q2? (Note: Enter your answer rounded to two decimal places. For example, if your answer is “1.235” then enter it as “1.24”)
Your answer: - Q14NAT1.5 Marks·Write the number
What is the value of Q3? (Note: Enter your answer rounded to two decimal places. For example, if your answer is “1.235” then enter it as “1.24”)
Your answer: - Q15NAT1.5 Marks·Write the number
What is the value of Q4? (Note: Enter your answer rounded to two decimal places. For example, if your answer is “1.235” then enter it as “1.24”)
Your answer: - Q16NAT2 Marks·Write the number
What is the value of Q5? (Note: Enter your answer rounded to two decimal places. For example, if your answer is “1.235” then enter it as “1.24”)
Your answer: - Q17MCQ1 Mark·Choose one option
At a 15% significance level, Dr. Milo thinks that the gas consumption at his company is affected by the number of BA, TACC and HAD that are made in a day. Then what do you conclude about Dr. Milo?
- ADr. Milo is dumb and does not know statistics.
- BDr. Milo is a genius and he is right.
- CCannot comment on Dr. Milo’s conclusion without more information
End Term · 13 Apr 2025 (FN)End Term
Read the passage below, then answer Q18–Q20
(The following is a purely imaginary scenario)
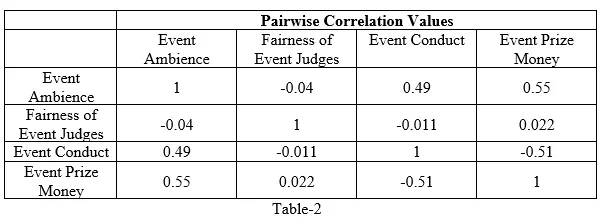
A survey was conducted among 100 students who participated in all events at IITMs recent “Saarang” event. The students were asked to rate various aspects of their experience on a scale of “-5 to +5”, where “-5” indicates a very negative experience and “+5” indicates a very positive experience. The average student rating for each event was taken across four key parameters: “Event Ambience”, “Fairness of Event Judges”, “Event Conduct”, “Event Prize Money”. The target variable was “Event Performance” which measures the overall performance of each event. Based on the collected data, a correlation matrix as specified in Table-2 is obtained for the independent variables. With this information, answer the given sub-questions
 Q18NAT1 Mark·Write the number
What would be the R-Square value if a model is built with “Event Conduct” as the independent variable and “Event Prize Money” as the dependent variable? (Note: Enter the answer in percentage rounded to two decimal places without the “%” symbol. For example, if the answer is “1.234%”, then enter it as “1.23”)
Your answer:- Q19NAT1 Mark·Write the number
What would be the Adjusted R-Square value if a model is built between “Fairness of Event Judges” as the independent variable and “Event Ambience” as the dependent variable? (Note: Enter the answer in percentage rounded to two decimal places without the “%” symbol. For example, if the answer is “1.234%”, then enter it as “1.23”)
Your answer: - Q20NAT2 Marks·Write the number
What will be the percentage increase in the standard error corresponding to the beta value of “Event Ambience”, if a multiple linear regression model where both “Event Ambience” and “Event Price Money” are used as explanatory variables to predict “Event Performance”? (Note: Enter the answer in percentage rounded to two decimal places. For example, if the answer is “1.234%”, then enter it as “1.23”)
Your answer:
End Term · 22 Dec 2024 (AN)End Term
Read the passage below, then answer Q21–Q22
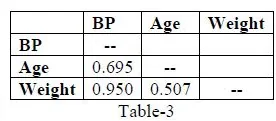
A doctor is of the opinion that “Blood Pressure (BP)” is affected by “Age” and “Weight”. Based on past data, the correlation between these three variables is identified and provided in Table-3. Then answer the given subquestions.
 Q21NAT1 Mark·Write the number
If a linear regression model is built between “BP” and “Age”, then how much percentage of variability in BP can be explained by Age? (Note: Enter your answer in percentage rounded to two decimal places. Eg: If your answer is “10.256%”, then enter the answer as “10.26”)
Your answer:- Q22NAT1 Mark·Write the number
What is the VIF for “Weight” with respect to “Age”? (Note: Enter your answer in decimal rounded to two decimal places. Eg: If your answer is “10.256”, then enter it as “10.26”)
Your answer:
Official KeyMaster Answer Key & Explanations
Official answer keys from IIT Madras BS past papers. Click any question to review.
Reveal KeyCollapse Key
Master Answer Key & Explanations
Official answer keys from IIT Madras BS past papers. Click any question to review.