Indian Institute of Technology Madras
BS Degree Programme · Examination & Study Paper
Business Analytics
Chi-square goodness-of-fit tests
Examination Instructions & Guidelines
- Solve on notebook/paper first before checking solutions.
- MCQ: Exactly 1 option is correct. Negative marking applies.
- MSQ: One or more options correct. Select all to score.
- NAT: Numerical response. No negative marking.
- Scientific calculator allowed for all calculations.
- Official answer key is sealed at the end of this sheet.
Quiz 1 · 26 Oct 2025 (AN)Quiz 1
Read the passage below, then answer Q1–Q4
(The following is a partially imaginary scenario)
The BA discourse is often cluttered with queries / requests related to solutions for Past Year Question Papers (PYQP). The course instructor, Dr. Milo, had been informing that students need to put in effort to find solutions by searching the discourse. However, the results seem to be disappointing. Therefore, Dr. Milo wanted to do a few basic analytics on discourse behaviour of students. Past student data was collected for the analysis.
Past data was collected for the BA terms in Jan-2022, May-2022, Sep-2022, Jan-2023, May-2023 and Sep-2023. For each term, 150 randomly selected unique student IDs were sampled. Of the 150 student IDs, 75 were “Male” and the remaining were “Female”. The learners in the discourse have either “followed the instructions” or “not followed the instructions” or “have not accessed the discourse at all” (these three are referred to as access categories). Specifically, for the sample data in the different terms (in sequence of earliest term to later term i.e. Jan-2022 to Sep-2023) it was observed that
1. For the Male sample: 30, 20, 35, 35, 45 and 35 had not followed the instructions respectively in each term (i.e 30 male learners had not followed the instructions in Jan-2022 term and so on) 2. For the Male sample: 20, 10, 15, 15, 15 and 10 had not accessed discourse at all respectively in each term (i.e 20 male learners had not accessed discourse at all in Jan-2022 term and so on) 3. For the female sample: 15, 22, 33, 25, 20 and 20 had followed the instructions respectively in each term (i.e 15 female learners had followed the instructions in Jan-2022 term and so on) 4. For the female sample: 30, 20, 25, 25, 25 and 10 had not accessed discourse at all respectively in each term (i.e 30 female learners had not accessed discourse at all in Jan-2022 term and so on) Moreover, Dr. Milo assumes that all learners in the “followed the instructions” category are Uniformly distributed between 4 and 75. A total of 6 bins of equal area are created for performing the appropriate statistical test. Each term is a sample point.
Given this information, answer the sub questions.
Q1NAT1 Mark·Write the numberWhat is the probability that a specific term will fall in Bin-4 when performing the hypothesis test to check if Dr. Milo’s assumption that all learners in the “followed the instructions” category are Uniformly distributed? (Note: Enter the answer rounded to two decimal places. For example, if the answer is “0.235”, then enter it as “0.24”)
Your answer:- Q2NAT1 Mark·Write the number
What will be the expected frequency in Bin-2 when performing the hypothesis test to check if Dr. Milo’s assumption that all learners in the “followed the instructions” category are Uniformly distributed? (Note: Enter the answer rounded to two decimal places. For example, if the answer is “1.235”, then enter it as “1.24”)
Your answer: - Q3NAT3 Marks·Write the number
What is the value of the computed test statistic which will be used to check if Dr. Milo’s assumption that all learners in the “followed the instructions” category are Uniformly distributed? (Note: Enter the answer rounded to two decimal places. For example, if the answer is “1.235”, then enter it as “1.24”)
Your answer: - Q4NAT1 Mark·Write the number
How many degrees of freedom is present for the hypothesis test used to check if Dr. Milo’s assumption that all learners in the “followed the instructions” category are Uniformly distributed?
Your answer:
End Term · 31 Aug 2025 (FN)End Term
- Q5MSQ1 Mark·Choose all correct options
The computed p-value of a chi-square goodness-of-fit test is 0.167. Then, which of the following statements are TRUE
- AAt a 5% level of significance, the null hypothesis is rejected
- BAt a 5% level of significance, the null hypothesis is not-rejected
- CAt a 10% level of significance, the null hypothesis is rejected
- DAt a 10% level of significance, the null hypothesis is not-rejected
- EAt a 5% level of significance, the alternative hypothesis is rejected
- FAt a 5% level of significance, the alternative hypothesis is not-rejected
- GAt a 10% level of significance, the alternative hypothesis is rejected
- HAt a 10% level of significance, the alternative hypothesis is not-rejected
- ICannot conclude only based on the P-value and Significance Level. Need the computed Chi-Square value as well.
Read the passage below, then answer Q6–Q10
The Following Comprehension and Related Questions are Purely Hypothetical
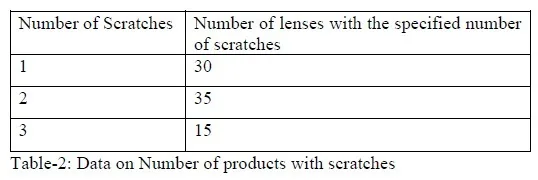
A manufacturer produces lenses for sunglasses. In a given day, a total of 100 products were produced. Products produced can have anywhere between no scratches to 3 scratches. From past experience, it is seen that the lenses break if it has more than 3 scratches. Broken lenses are not included in the 100 units which are provided to you. On examining the 100 units, the below Table- 2 on the products with scratches is determined. Based on the production lot of 100 units (given sample), you are asked to check if the “Number of Scratches on produced lenses” follows a Poisson Distribution. Given this information, answer the given subquestions.
 Q6NAT1 Mark·Write the number
What would be the mean of the distribution, if you want to check the hypothesis “The number of scratches on a produced lens follows a Poisson Distribution”? [Note: Enter your answer rounded to two decimal places. For example, if your answer is 1.235 then enter the answer as “1.24”]
Your answer:- Q7MCQ0.5 Marks·Choose one option
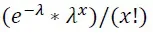
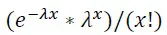
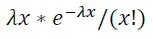
Which of the following is the correct PMF formula for a Poisson Distribution?
- A
- B

- C

- D
- E
- A
- Q8NAT0.5 Marks·Write the number
How many (count) of degrees of freedom will be presented for the computed test statistic for this problem if you want to check the hypothesis “The number of scratcheson a produced lens follows a Poisson Distribution”?
Your answer: - Q9NAT3 Marks·Write the number
What is the value of the computed test statistic for the test to be performed if you want to check the hypothesis “The number of scratches on a produced lens follows a Poisson Distribution”? [Note: Enter your answer rounded to two decimal places. For example, if your answer is 1.235 then enter the answer as “1.24”]
Your answer: - Q10MSQ1 Mark·Choose all correct options
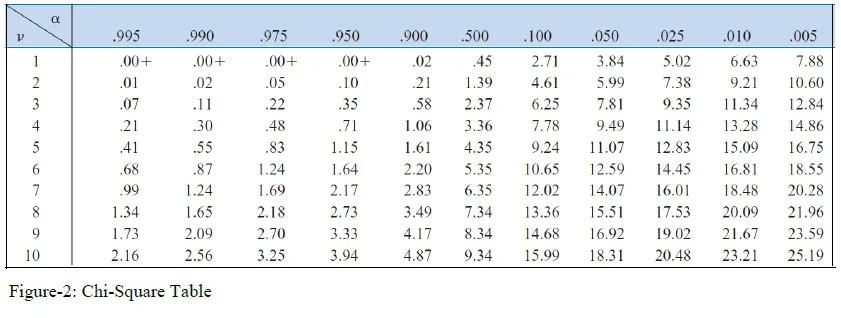
Based on the computed test statistic for the test to be performed, using Figure-2, at a significance level of 10% what will be concluded (choose all that are correct)?
- AReject the Null Hypothesis
- BDo not Reject the Null Hypothesis
- CReject the Alternative Hypothesis
- DDo not Reject the Alternative Hypothesis
- EAccept the Null Hypothesis
- FAccept the Alternative Hypothesis
End Term · 31 Aug 2025 (AN)End Term
Read the passage below, then answer Q11–Q14
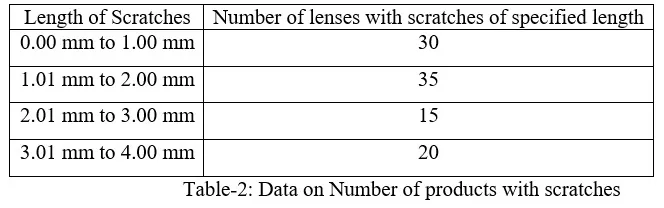
The Following Comprehension and Related Subquestions are Purely Hypothetical A manufacturer produces lenses for sunglasses. In a given day, a total of 100 products were produced. Products produced usually can have scratches. The manufacturer is interested to see if the length of the scratches on produced lenses is normally distributed. Hence, based on the production of 100 lenses, he has identified the length of scratch on each lens and the grouped data is presented to you in Table-2. Further, from sample, the manufacturer has computed the standard deviation to be 1.00. Based on the production lot of 100 units (given sample), you are asked to check if the “Length of Scratches on produced lenses” follows a Normal Distribution. Given this information, answer the given subquestions.
 Q11NAT2 Marks·Write the number
What would be the mean of the distribution, if you want to check the hypothesis “The length of scratches on a produced lens follows a Normal Distribution”? [Note: Enter your answer rounded to two decimal places. For example, if your answer is 1.235 then enter the answer as “1.24”]
Your answer:- Q12NAT1 Mark·Write the number
How many (count) of degrees of freedom will be presented for the computed test statistic for this problem if you want to check the hypothesis “The length of scratches on a produced lens follows a Normal Distribution”?
Your answer: - Q13NAT2 Marks·Write the number
What would be expected frequency in the last bin of the frequency table (Hint: The frequency table is obtained by only modifying Table-2 without adding any new bins)? [Note: Enter your answer rounded to two decimal places. For example, if your answer is 1.235 then enter the answer as “1.24”]
Your answer: - Q14MSQ1 Mark·Choose all correct options
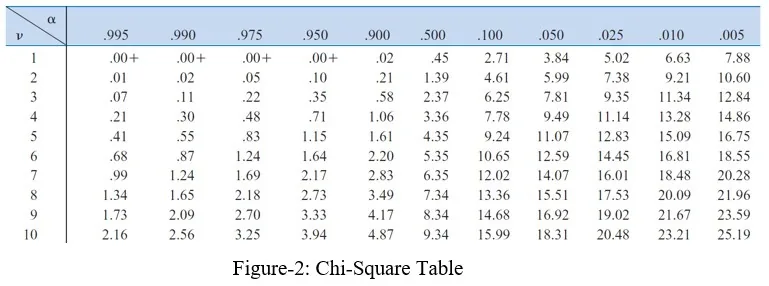
Say the computed test statistic for the test is 12.3. Then, using Figure-2, at a significance level of 10% what will be concluded (choose all that are correct)?
- AReject the Null Hypothesis
- BDo not Reject the Null Hypothesis
- CReject the Alternative Hypothesis
- DDo not Reject the Alternative Hypothesis
- EAccept the Null Hypothesis
- FAccept the Alternative Hypothesis
End Term · 13 Apr 2025 (FN)End Term
- Q15MSQ1 Mark·Choose all correct options
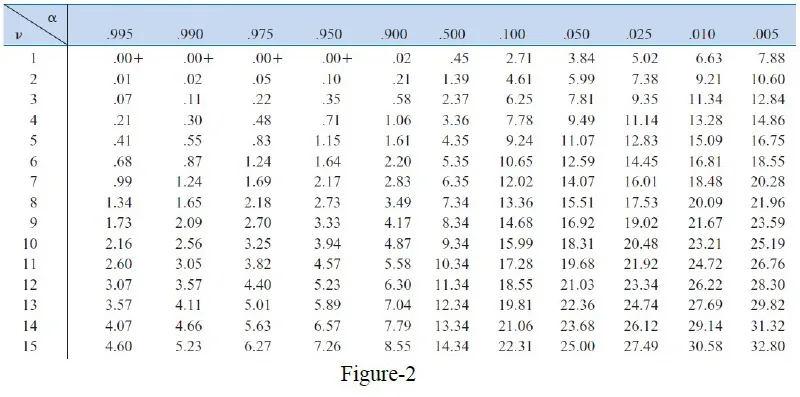
Given the Chisquare table in Figure-2, what is the conclusion from the test at a 95% significance level? (choose all that may be applicable)
- AREJECT the NULL HYPOTHESIS and conclude that the number of defects FOLLOWS a poisson distribution
- BDO NOT REJECT the NULL HYPOTHESIS and conclude that the number of defects FOLLOWS a poisson distribution
- CREJECT the NULL HYPOTHESIS and conclude that the number of defects DOES NOT FOLLOW a poisson distribution
- DDO NOT REJECT the NULL HYPOTHESIS and conclude that the number of defects DOES NOT FOLLOW a poisson distribution
- EREJECT the ALTERNATIVE HYPOTHESIS and conclude that the number of defects FOLLOWS a poisson distribution
- FDO NOT REJECT the ALTERNATIVE HYPOTHESIS and conclude that the number of defects FOLLOWS a poisson distribution
- GREJECT the ALTERNATIVE HYPOTHESIS and conclude that the number of defects DOES NOT FOLLOW a poisson distribution
- HDO NOT REJECT the ALTERNATIVE HYPOTHESIS and conclude that the number of defects DOES NOT FOLLOW a poisson distribution
Read the passage below, then answer Q16–Q18
(The following is a purely imaginary scenario)
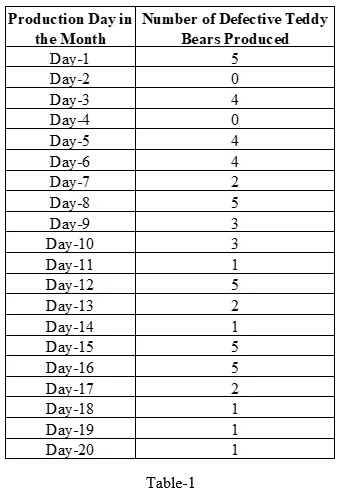
Ms. Teddy, is the owner of a toy manufacturing company. The company produces its iconic “Teddy Bear” toys in a facility that operates for 8 hours a day, and 20 days in month. Ms. Teddy has recently completed the BA course and wants to see if her manufacturing facility is producing toys where the defects per ship follows a Poisson distribution. Accordingly, she collected data for the past month indicating the number of defects produced in a shift. This is provided in Table-1. Using this information answer the given sub-questions
 Q16NAT1 Mark·Write the number
How many bins will be present in the frequency table for the statistical test to be conducted? (Note: Enter an INTEGER answer)
Your answer:- Q17NAT3 Marks·Write the number
What is the value of the computed test statistic for the statistical test that is to be performed by Ms. Teddy to very her claim? (Note: Enter the answer rounded to two decimal places. For example, if the answer is “1.234”, then enter it as “1.23”)
Your answer: - Q18NAT1 Mark·Write the number
How many degrees of freedom is present for the test statistic that is to be conducted by Ms. Teddy? (Note: Enter an INTEGER answer)
Your answer:
End Term · 22 Dec 2024 (AN)End Term
Read the passage below, then answer Q19–Q20
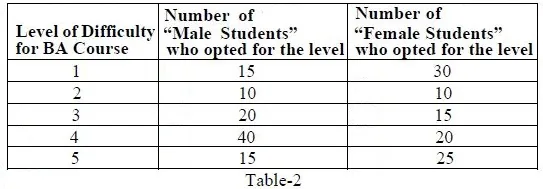
The BS program coordinators wanted to understand the difficulty level of the BA course. Hence, past learners of the BA course were asked to give a rating (on a scale of 1 to 5, 1 meaning “least difficult” and 5 implying “most difficult”). A total of 200 students (100 male and 100 female) were approached for the survey and the result of the same is provided in Table-2. Given this data, answer the sub-questions.
 Q19NAT2 Marks·Write the number
Assuming that each difficulty level splits the probability space into equal areas, the general belief is that the level of difficulty across all learners follows a normal distribution. To validate this belief, what is the value of the computed test statistic? (Enter your answer in decimals rounded to two decimal places. Eg: If your answer is 10.256, then enter it as 10.26)
Your answer:- Q20NAT1 Mark·Write the number
For the hypothesis test focusing on whether the data is distributed normally, how many (count of) degrees of freedoms is present?
Your answer: